ClimX
Home
Timeline
Tutorials
FAQ
Contact
Visualizations
Baselines ▼
Climatology
Gnn
Lps
Nn
☰
Home
Timeline
Tutorials
FAQ
Contact
Visualizations
Baselines:
Climatology
Gnn
Lps
Nn
Data Visualizations
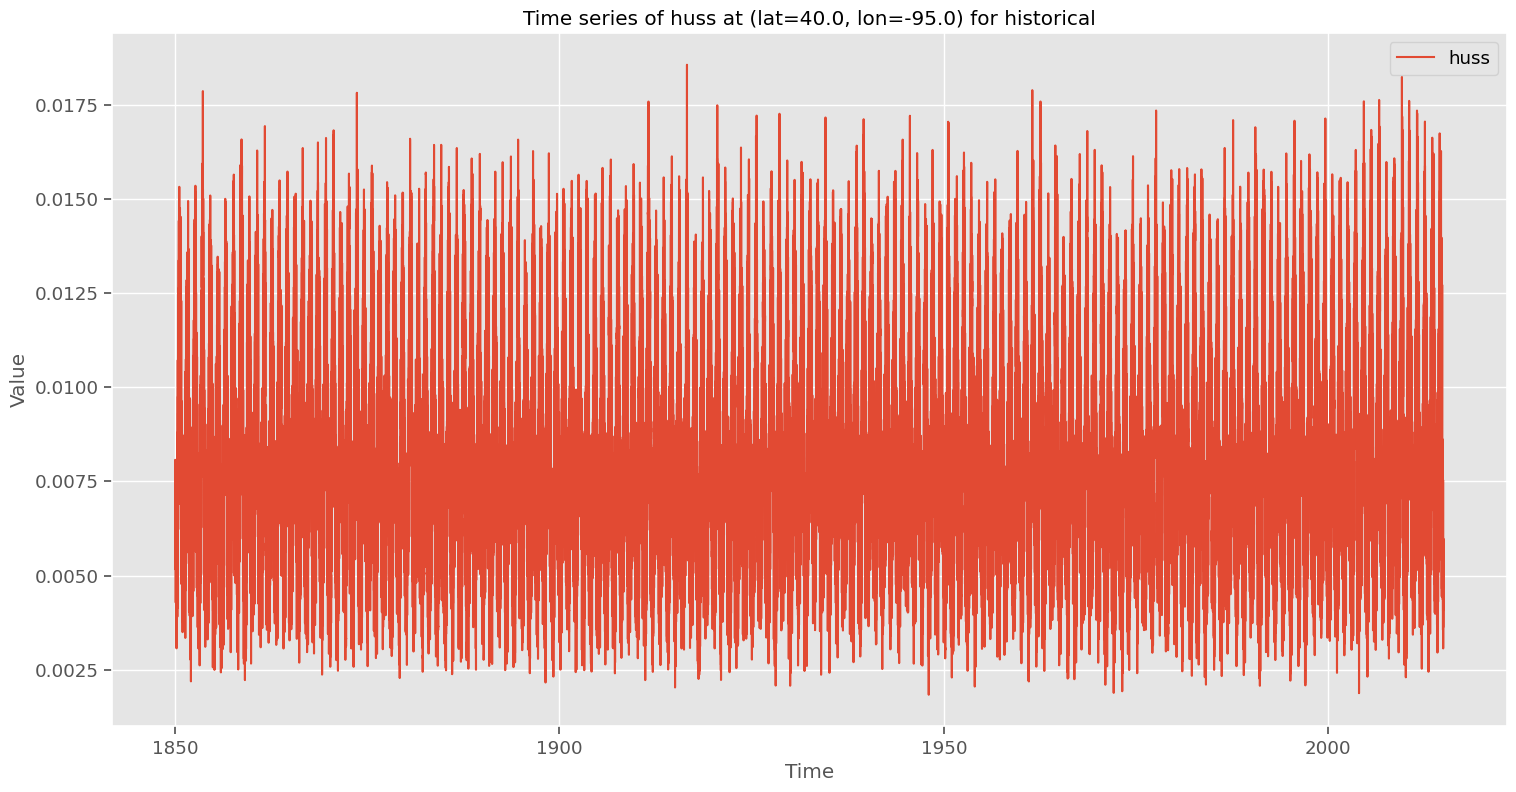
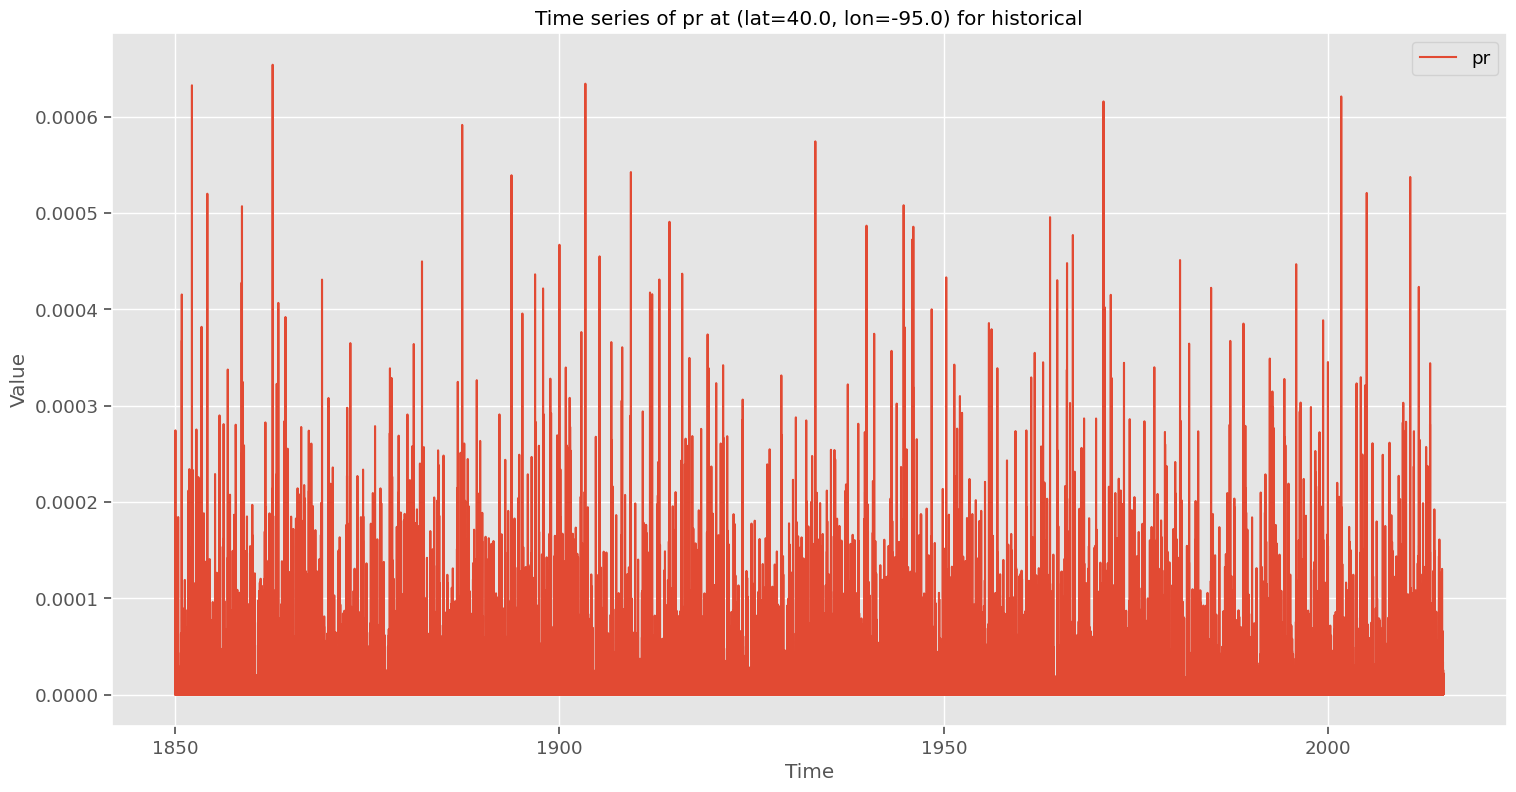
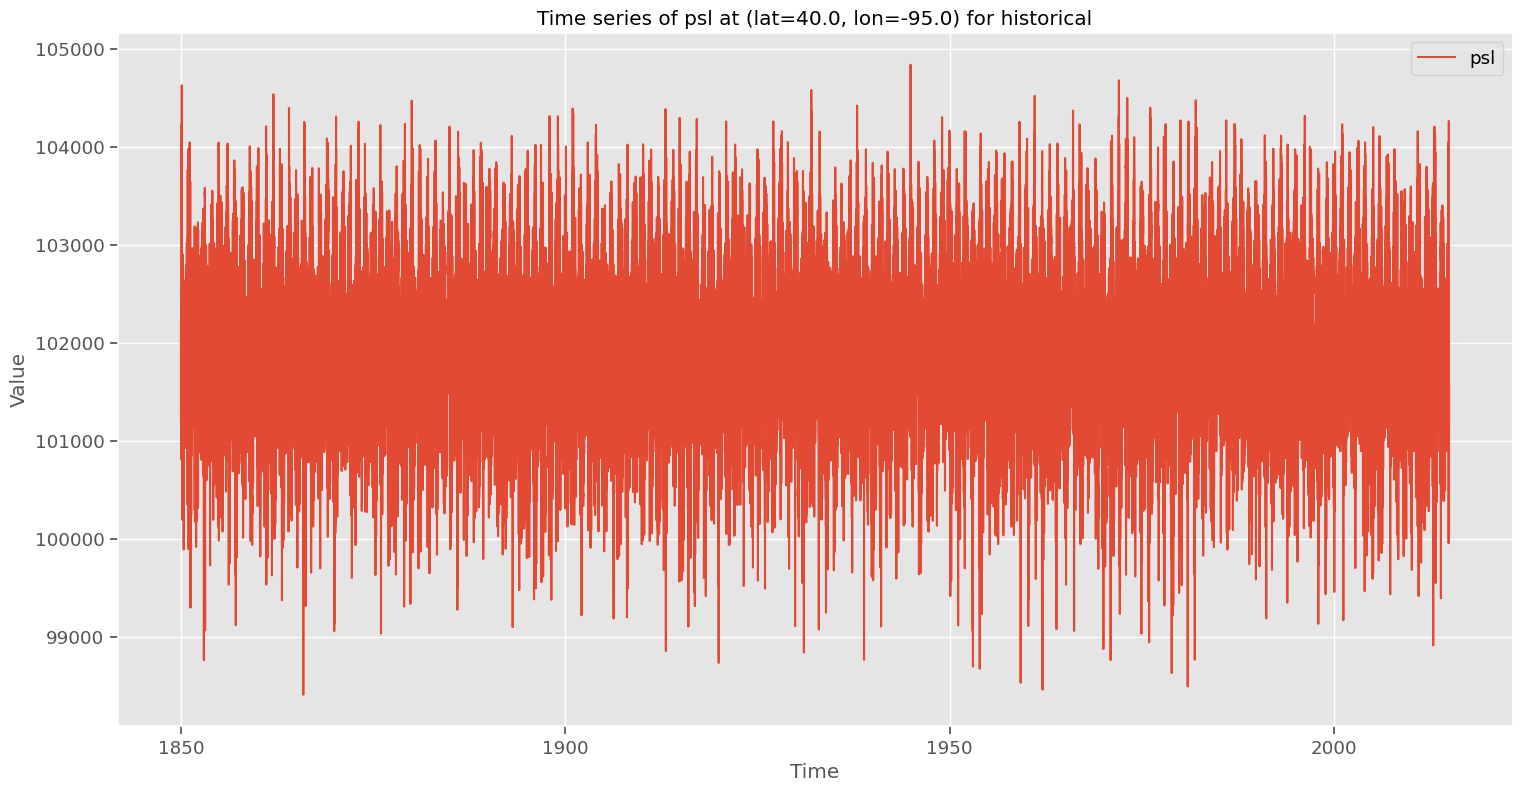
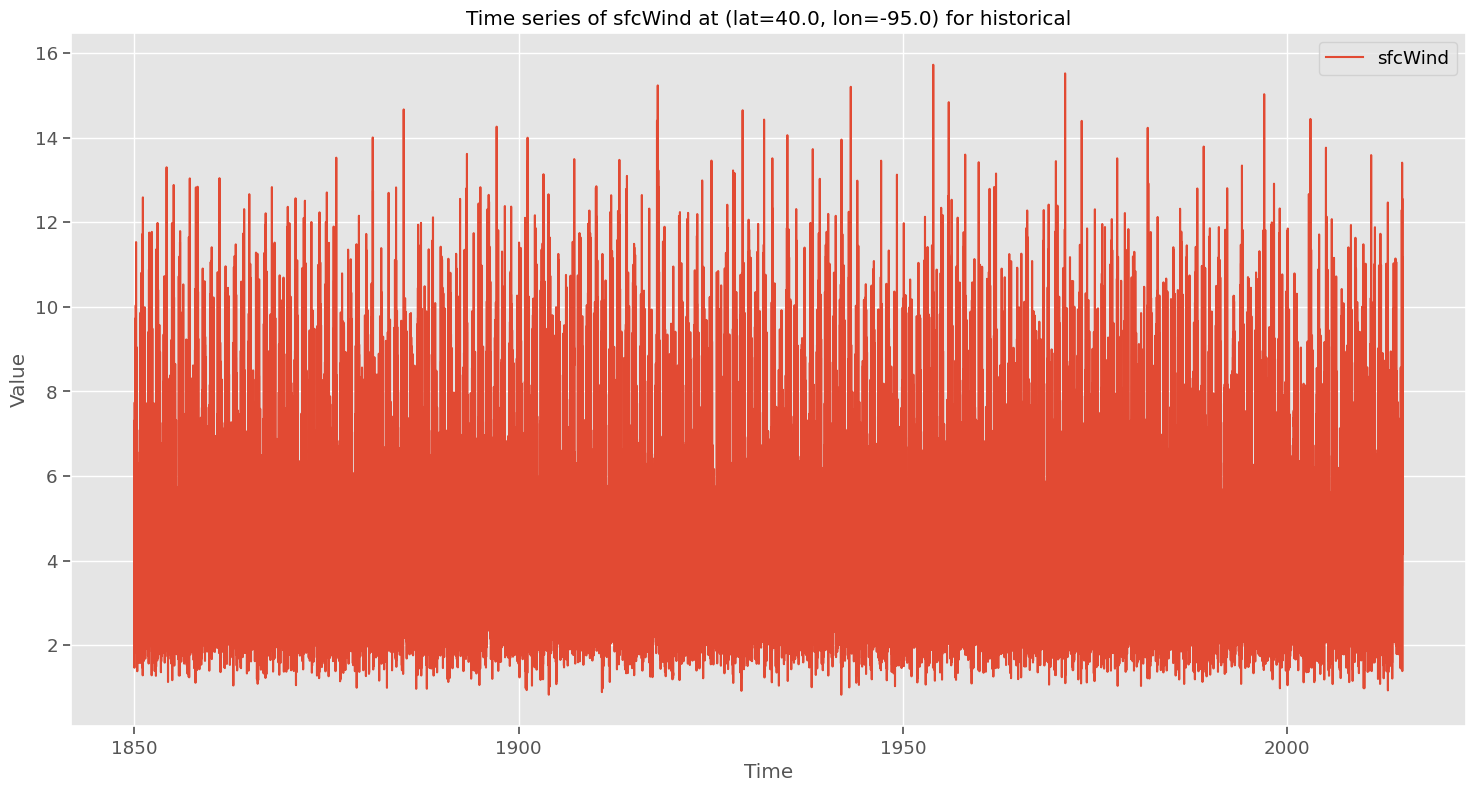
Below are the map and time series visualizations for the dataset variables.
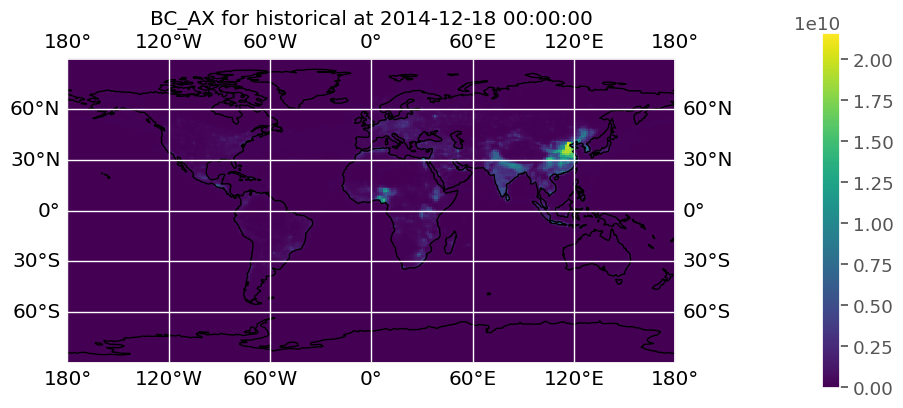
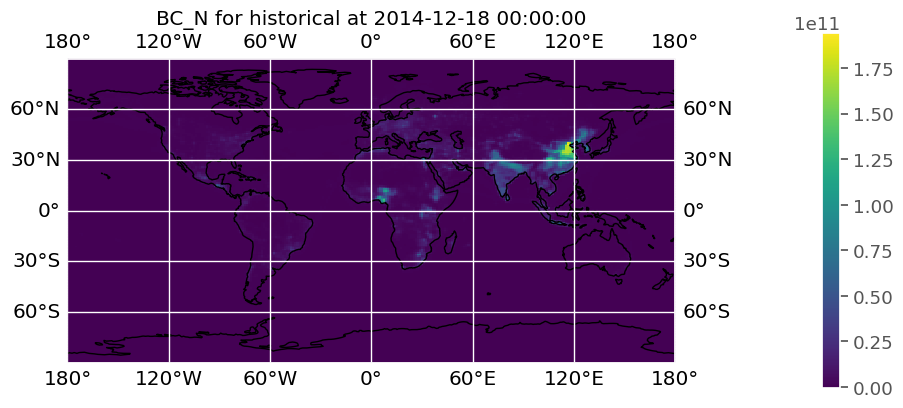
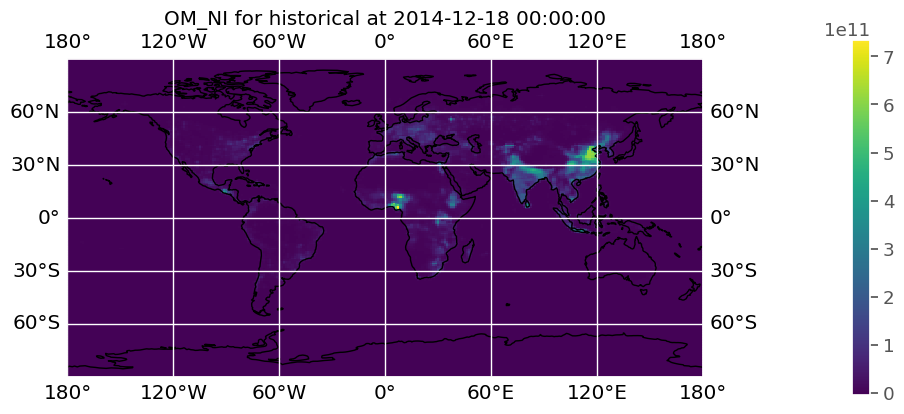
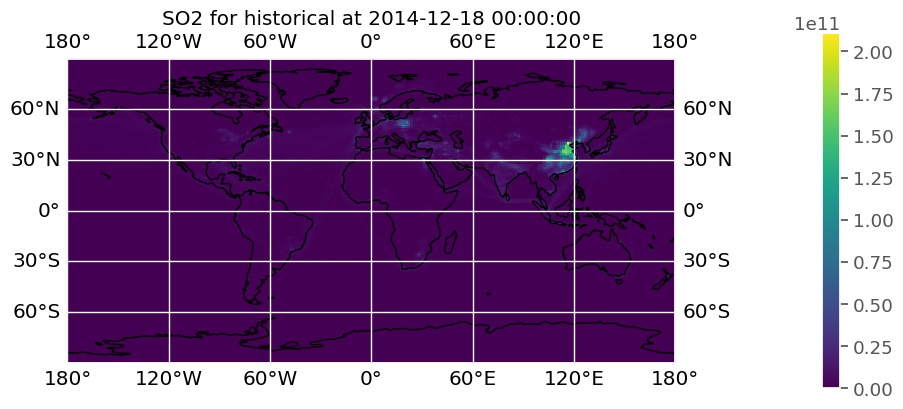
Spatial Maps
BC_AX_historical_2014-12-18 00:00:00
BC_N_historical_2014-12-18 00:00:00
OM_NI_historical_2014-12-18 00:00:00
SO2_historical_2014-12-18 00:00:00
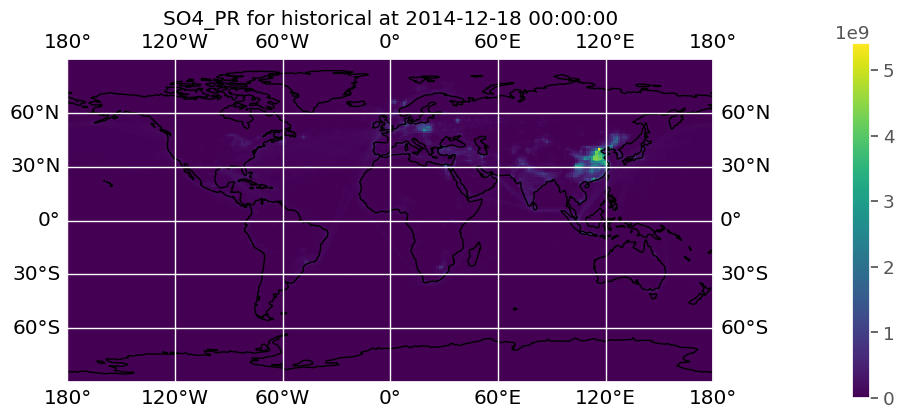
SO4_PR_historical_2014-12-18 00:00:00
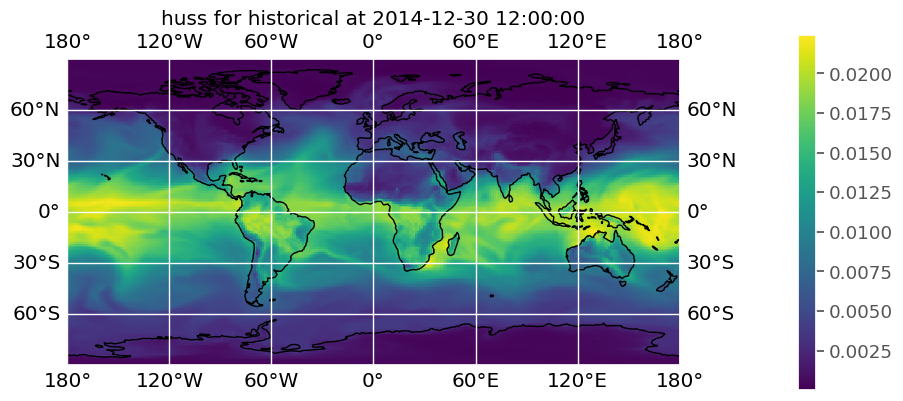
huss_historical_2014-12-30 12:00:00
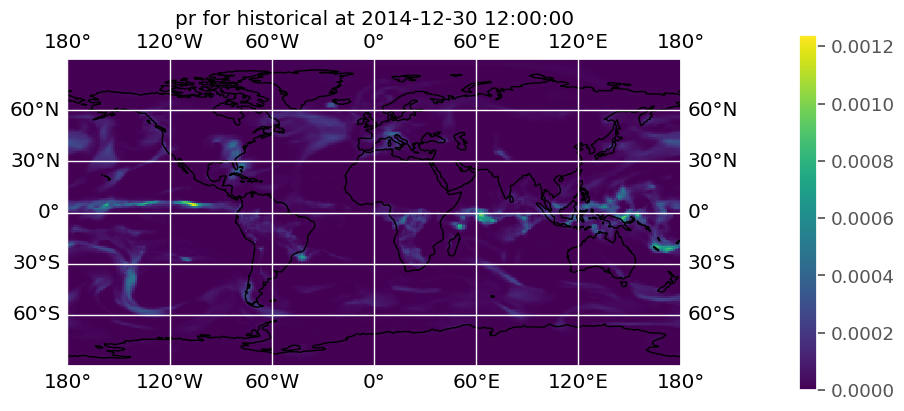
pr_historical_2014-12-30 12:00:00
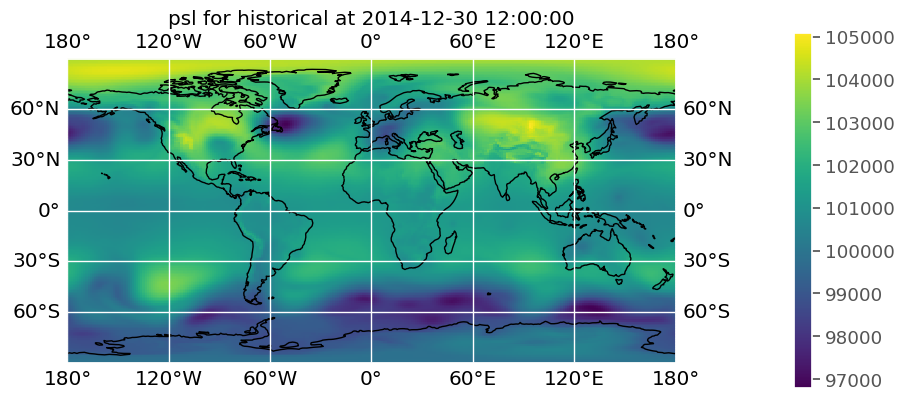
psl_historical_2014-12-30 12:00:00
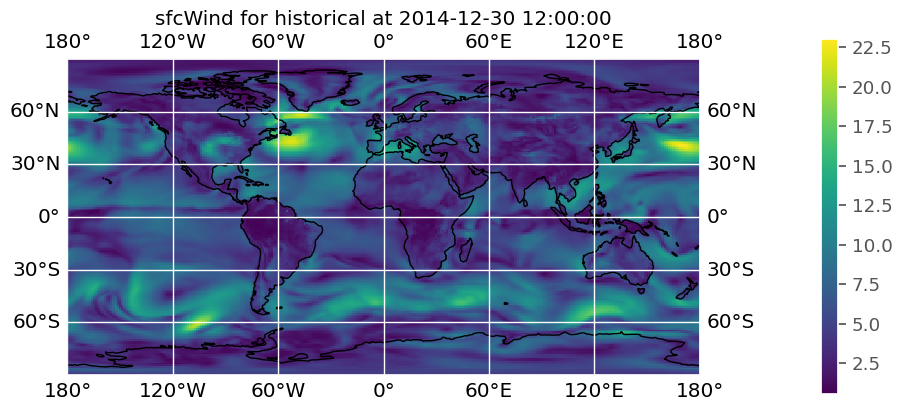
sfcWind_historical_2014-12-30 12:00:00
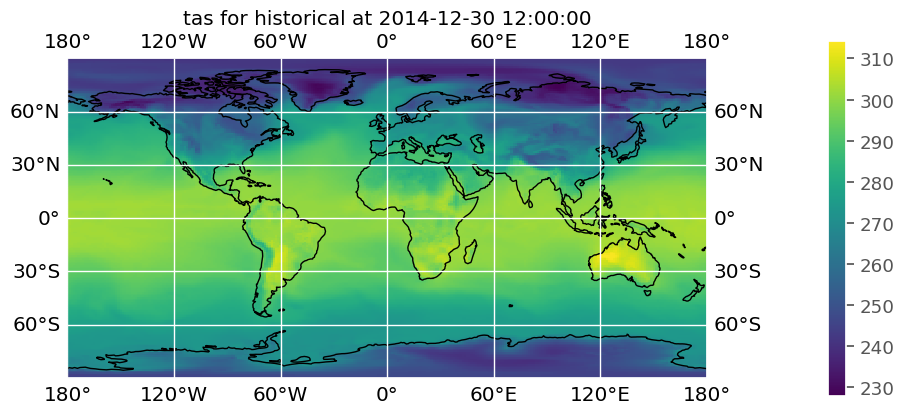
tas_historical_2014-12-30 12:00:00
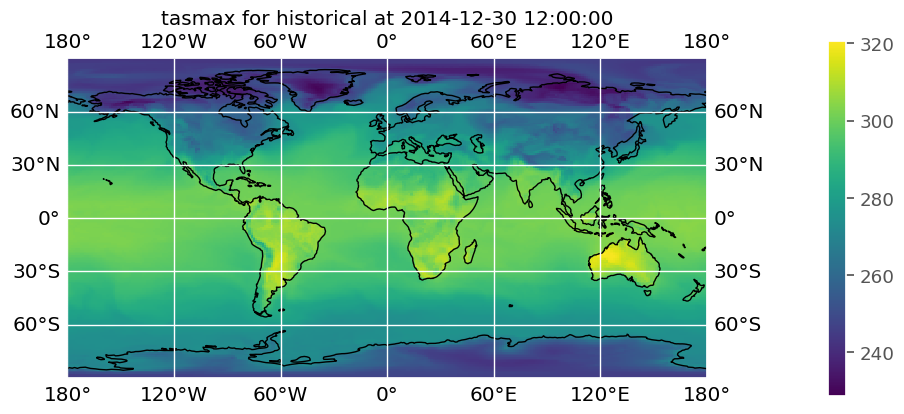
tasmax_historical_2014-12-30 12:00:00
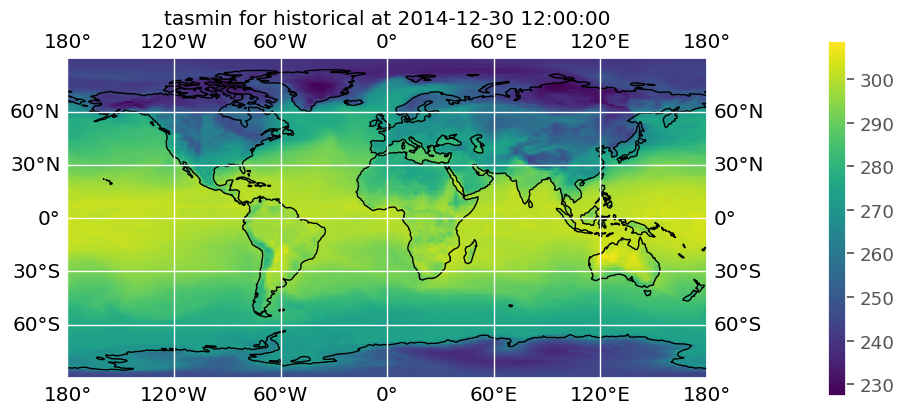
tasmin_historical_2014-12-30 12:00:00
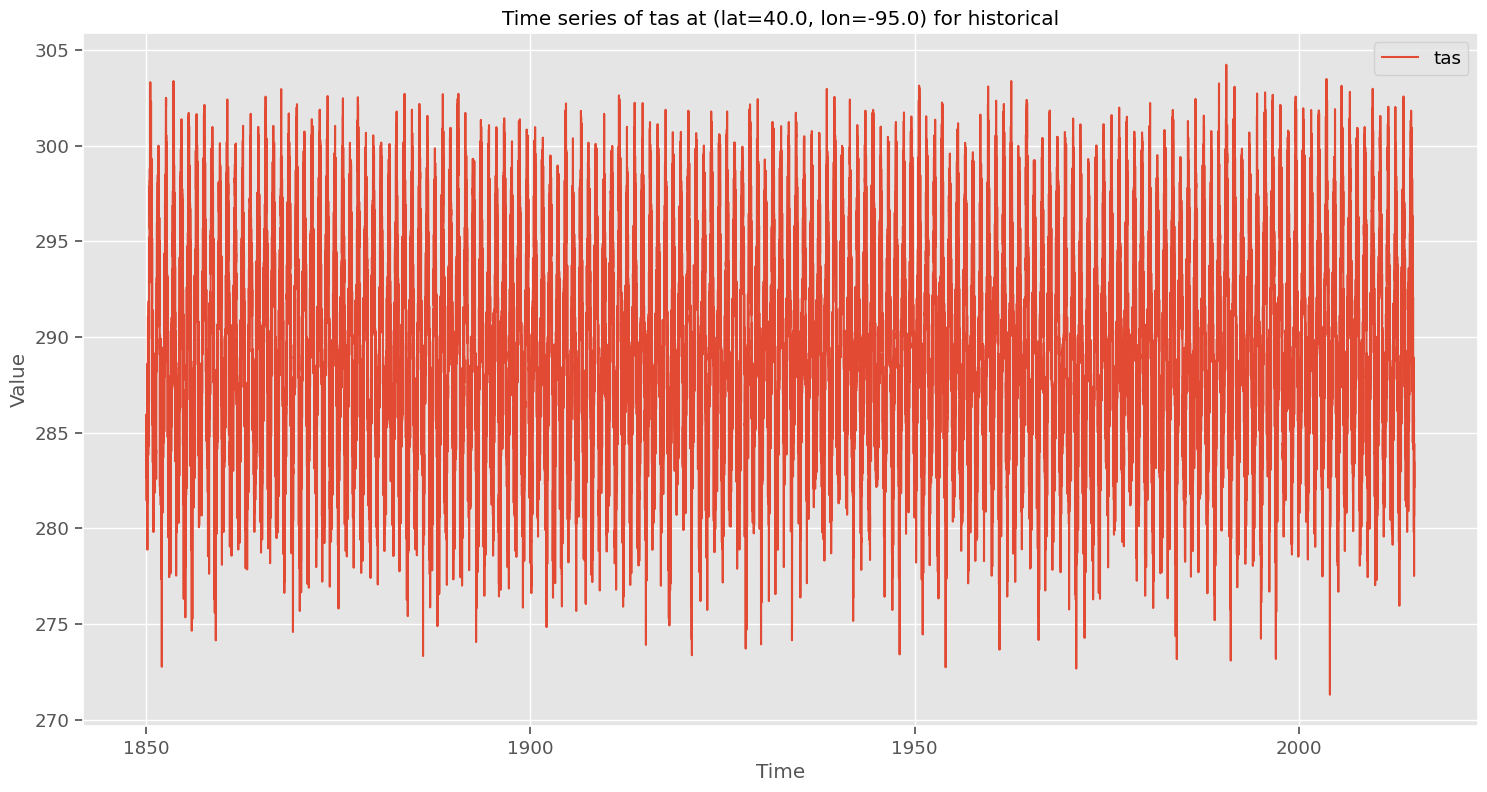
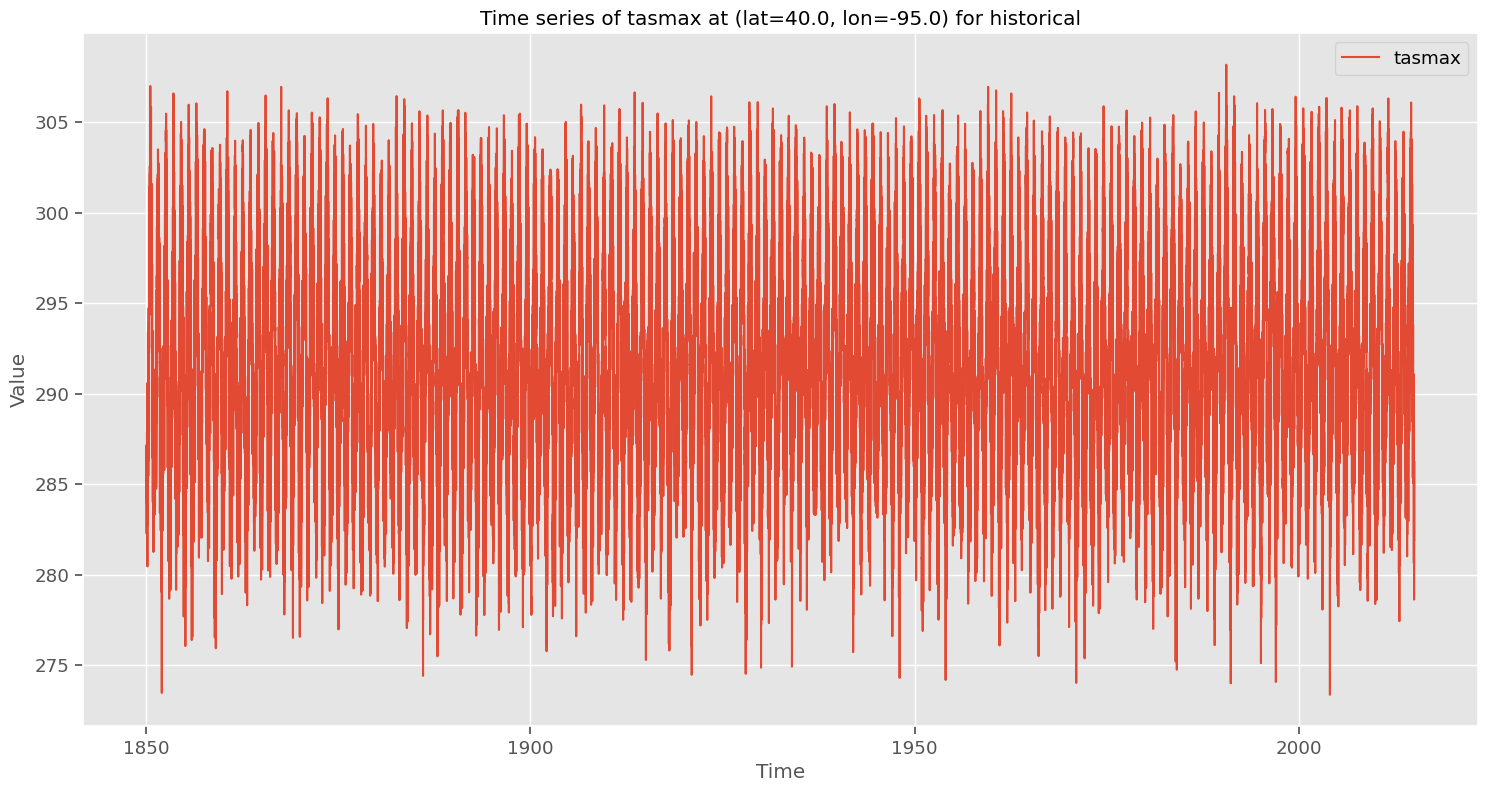
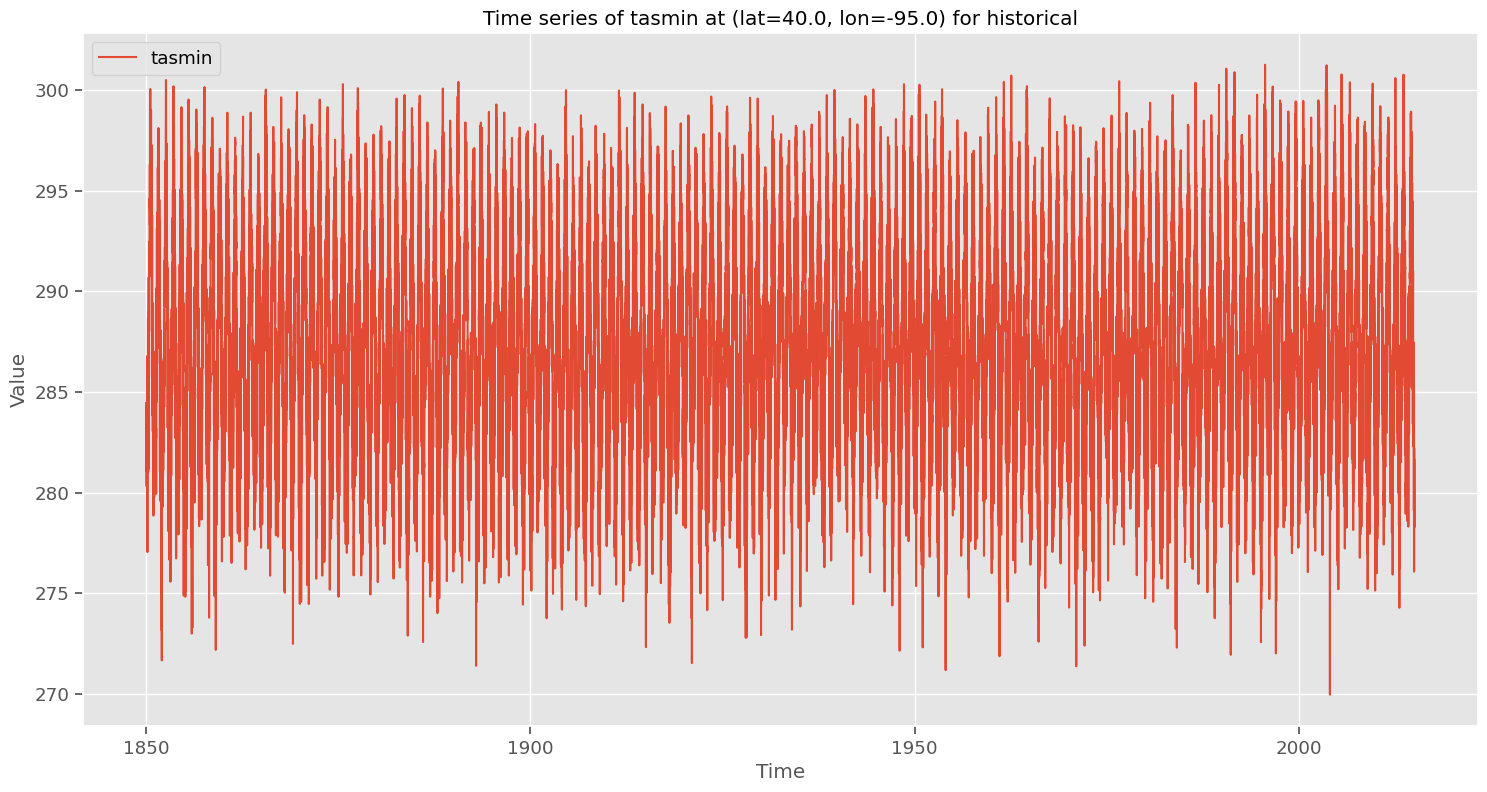
Time Series
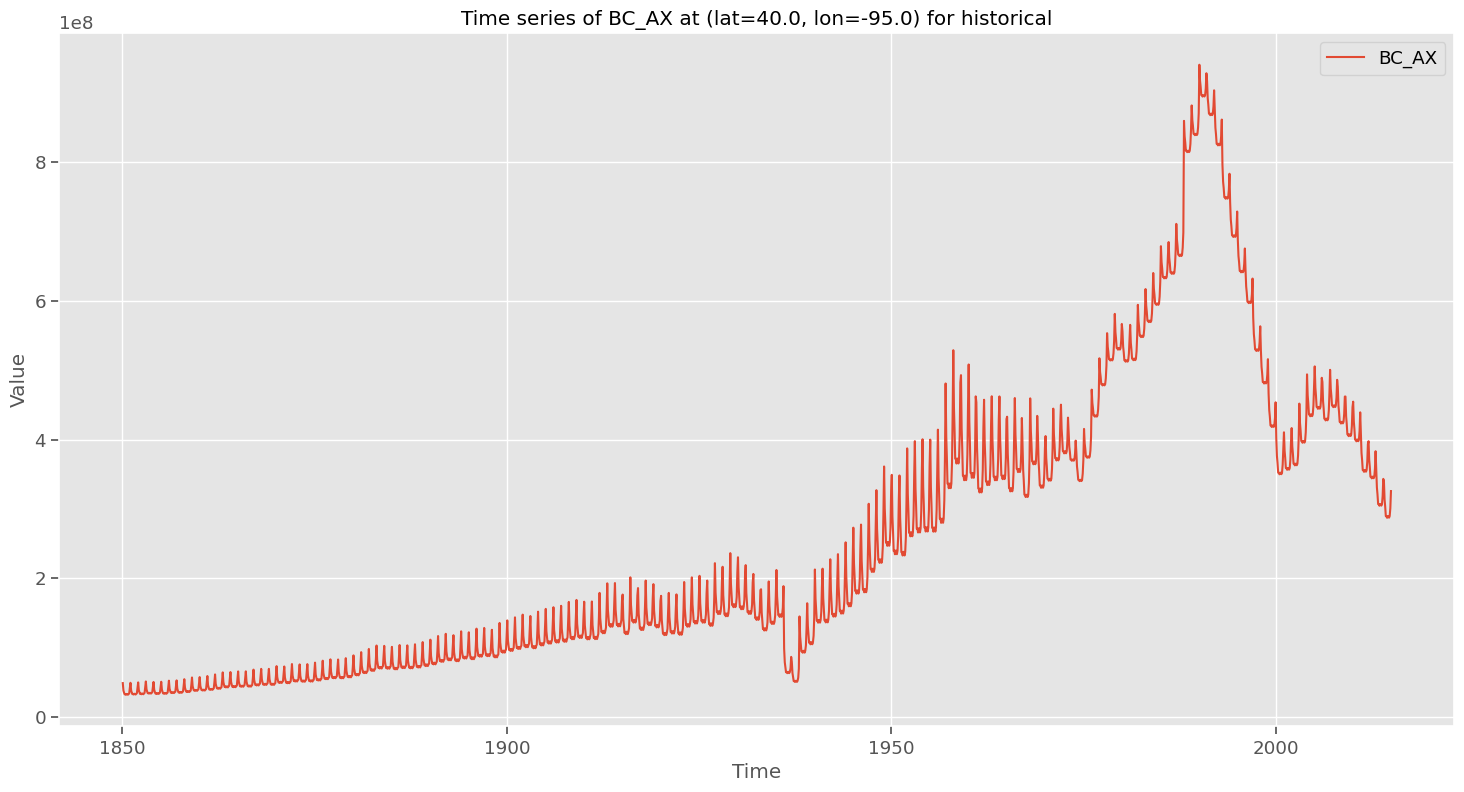
BC_AX_historical_40.0_-95.0
BC_N_historical_40.0_-95.0
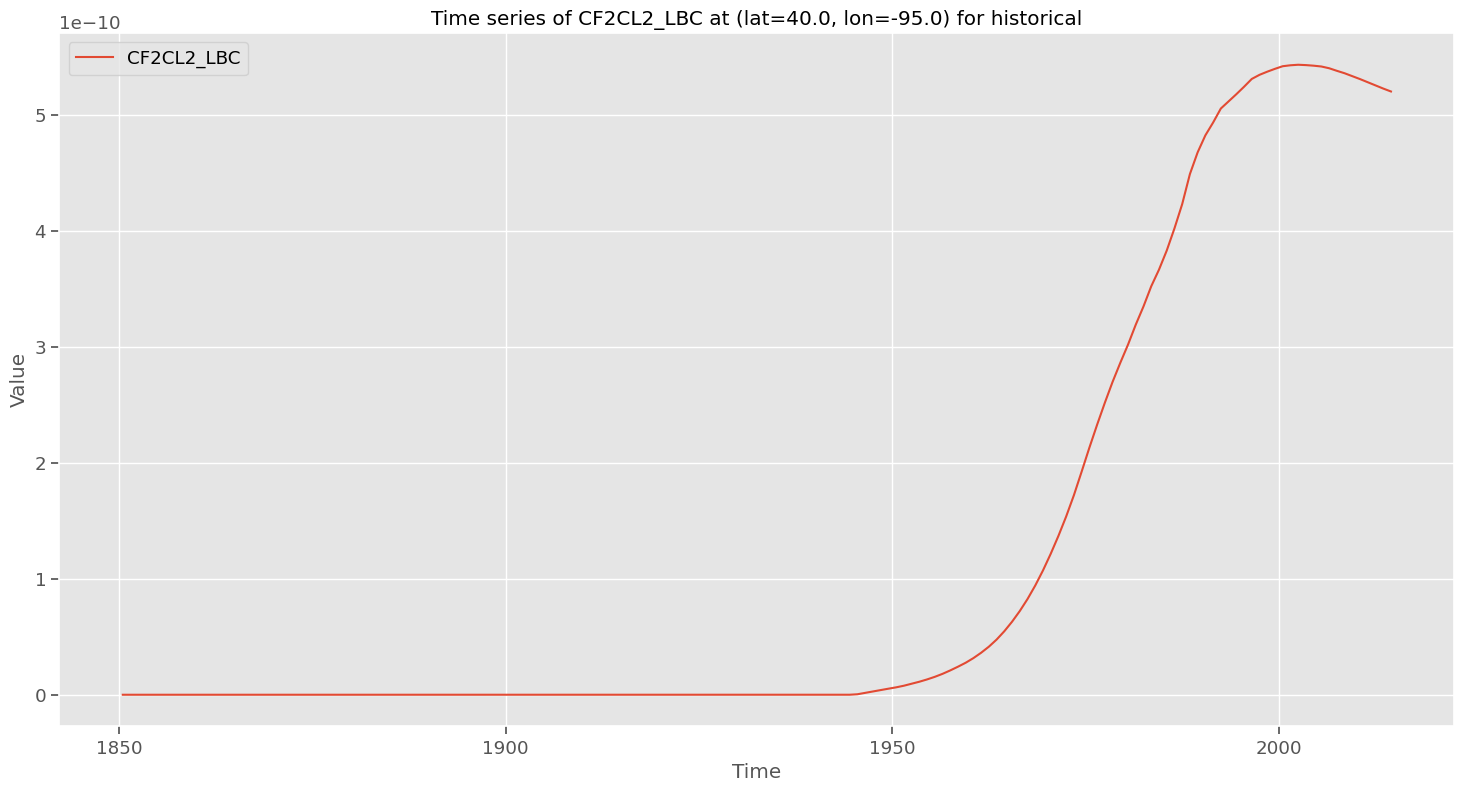
CF2CL2_LBC_historical_40.0_-95.0
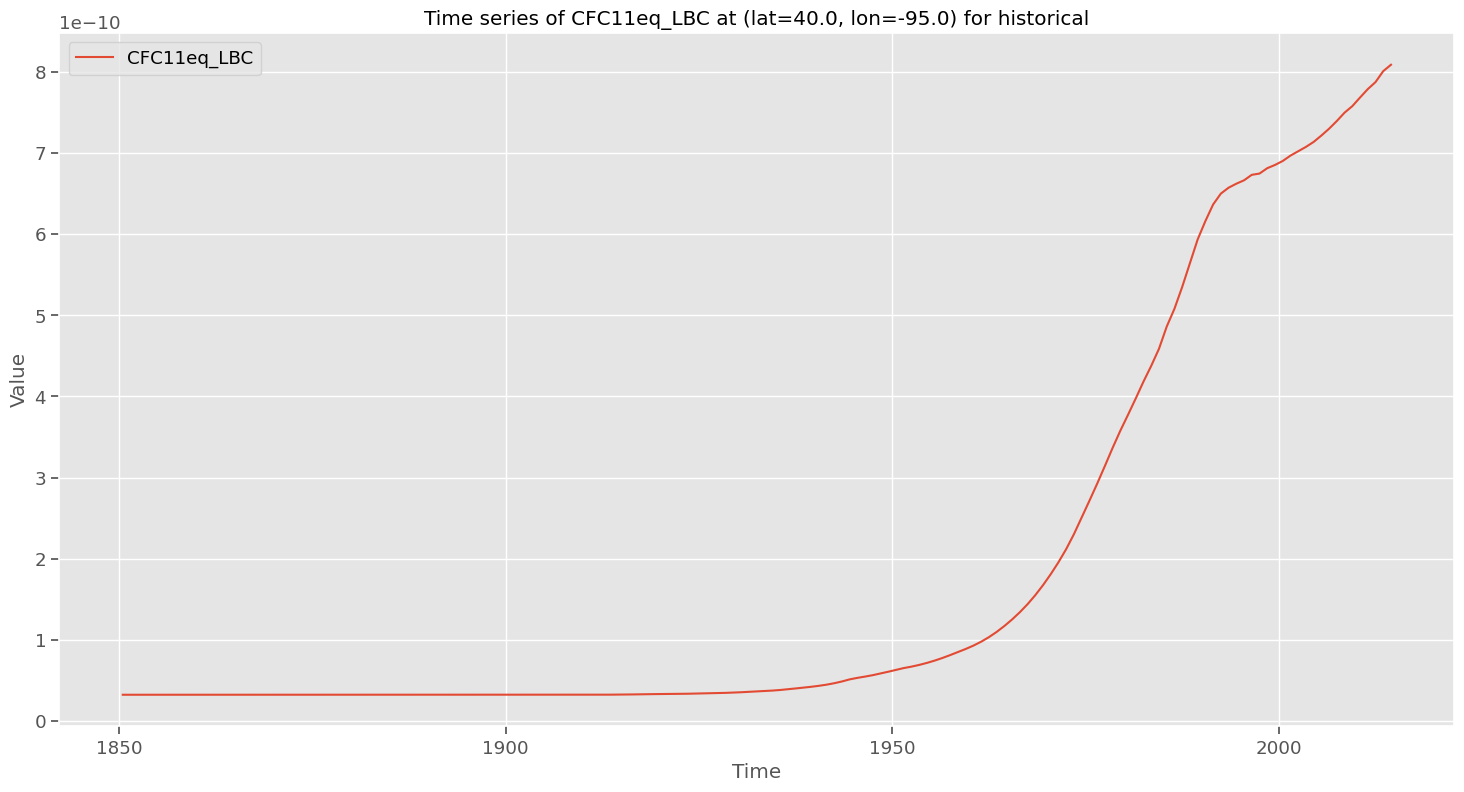
CFC11eq_LBC_historical_40.0_-95.0
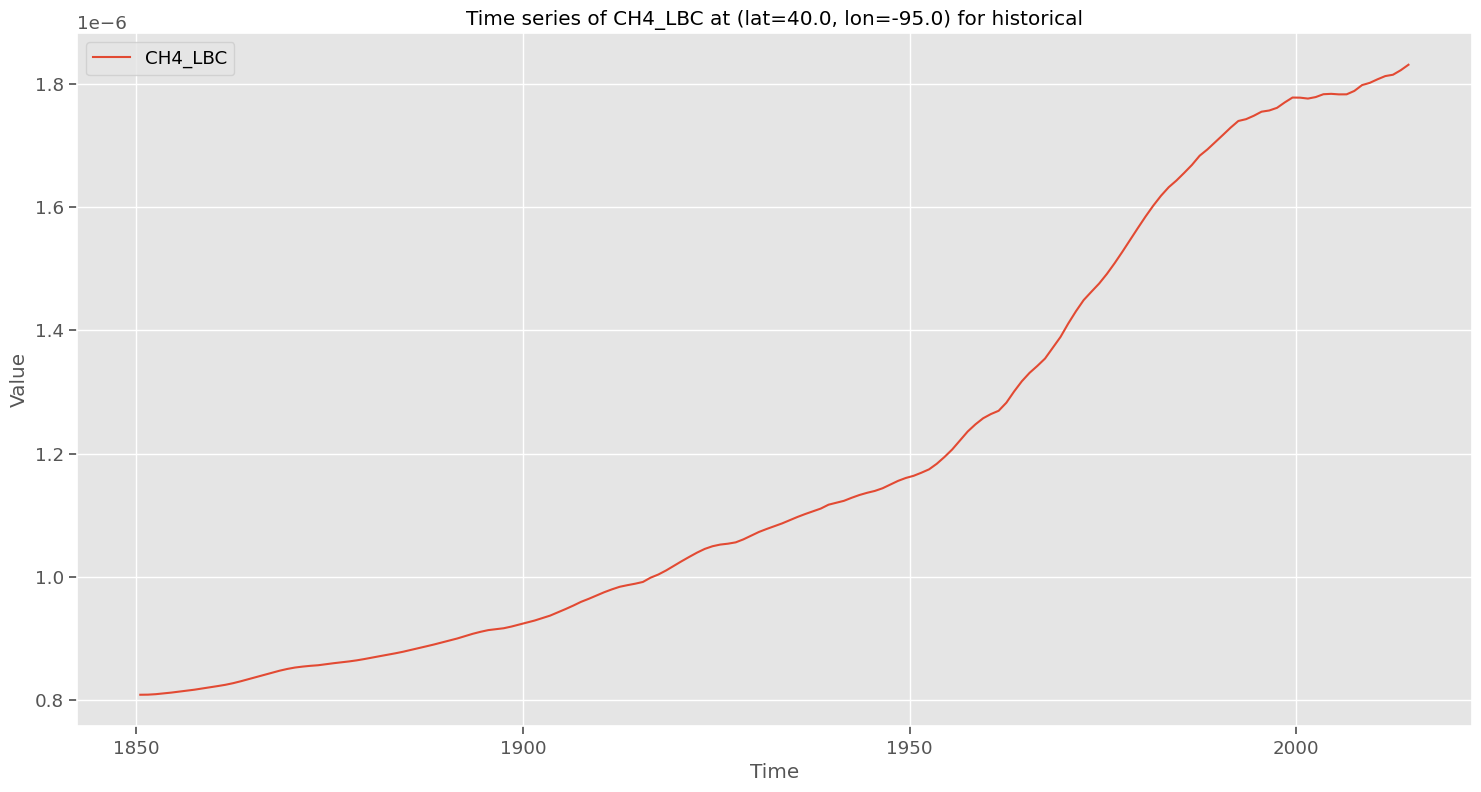
CH4_LBC_historical_40.0_-95.0
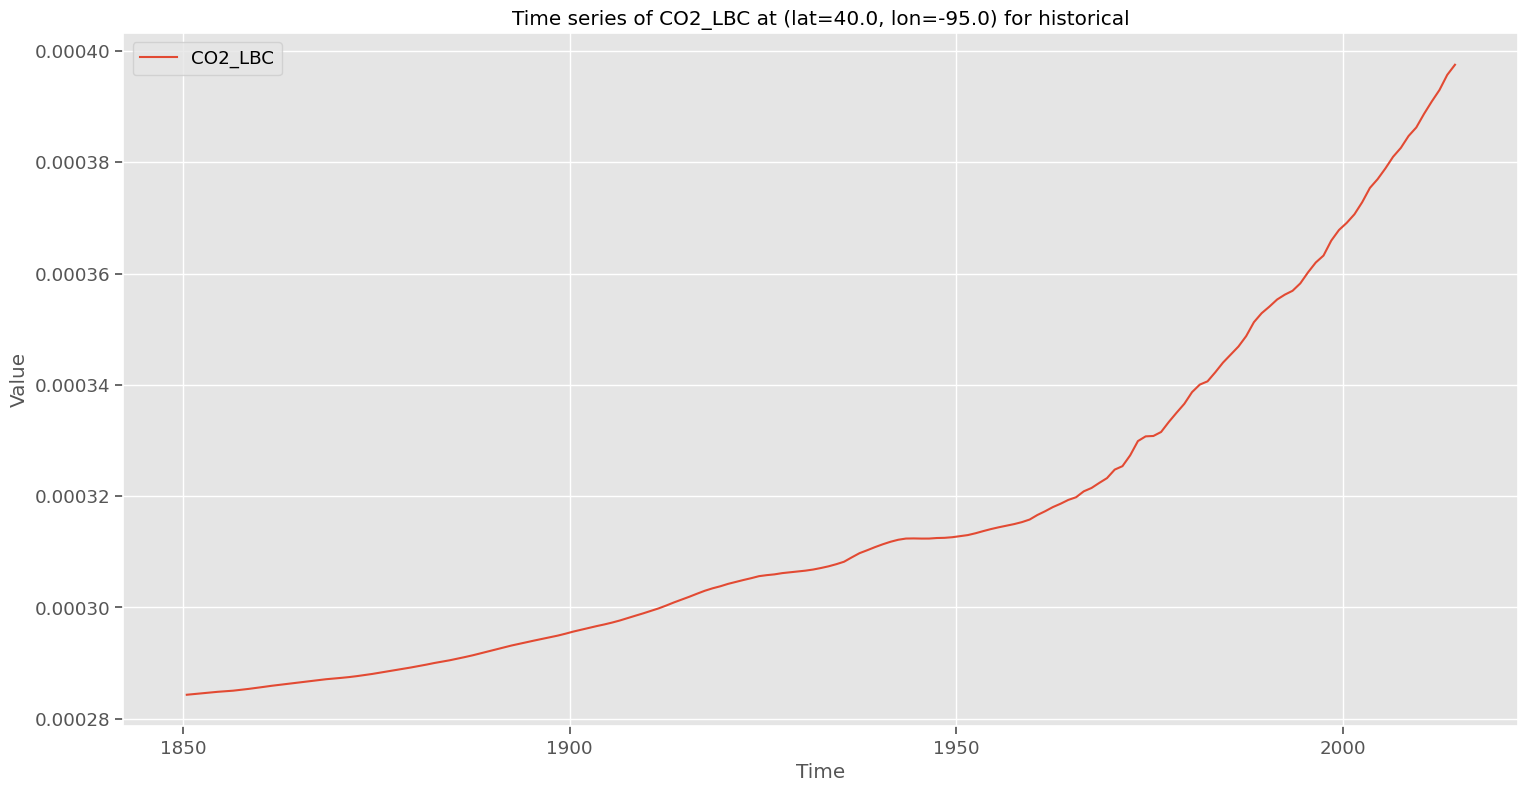
CO2_LBC_historical_40.0_-95.0
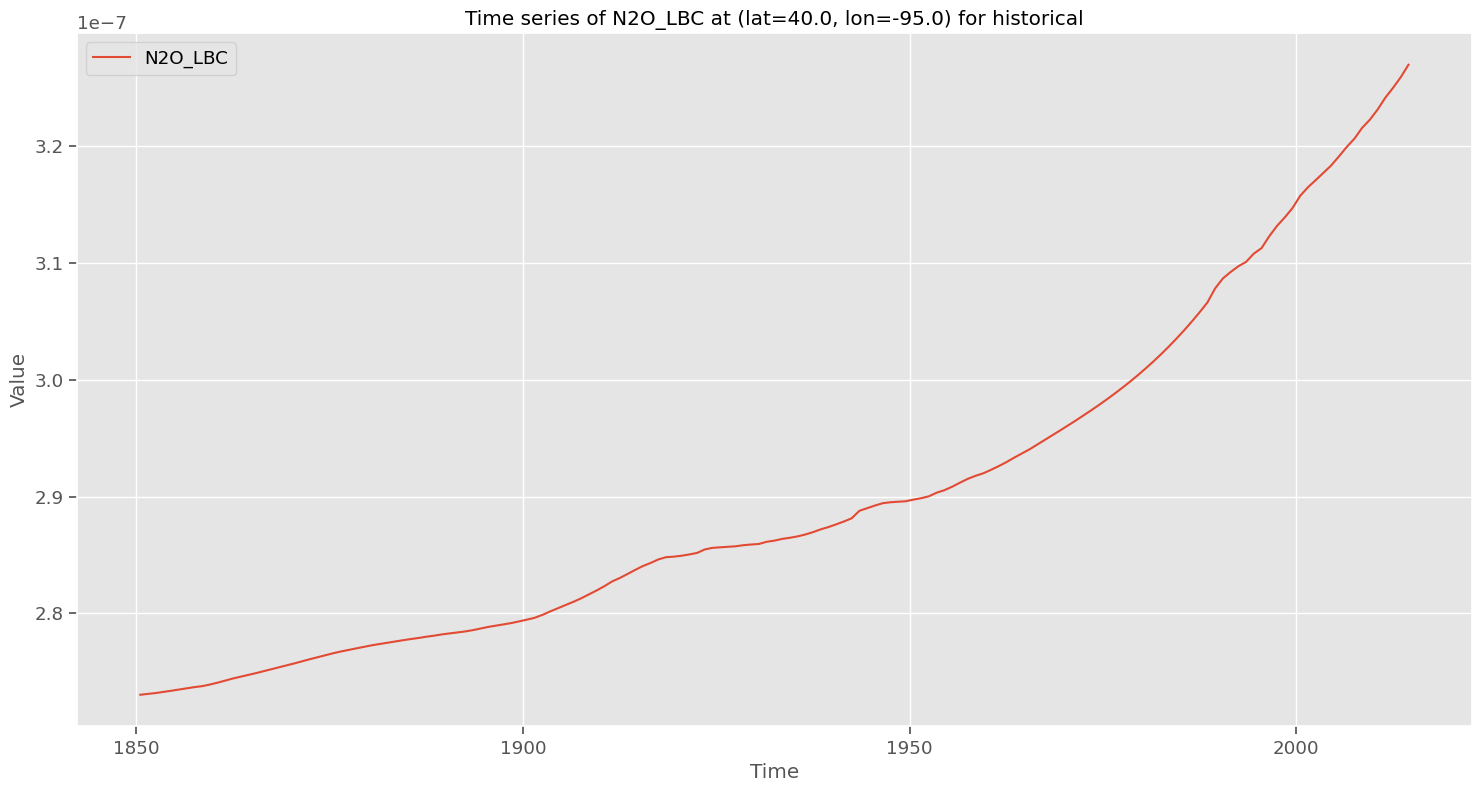
N2O_LBC_historical_40.0_-95.0
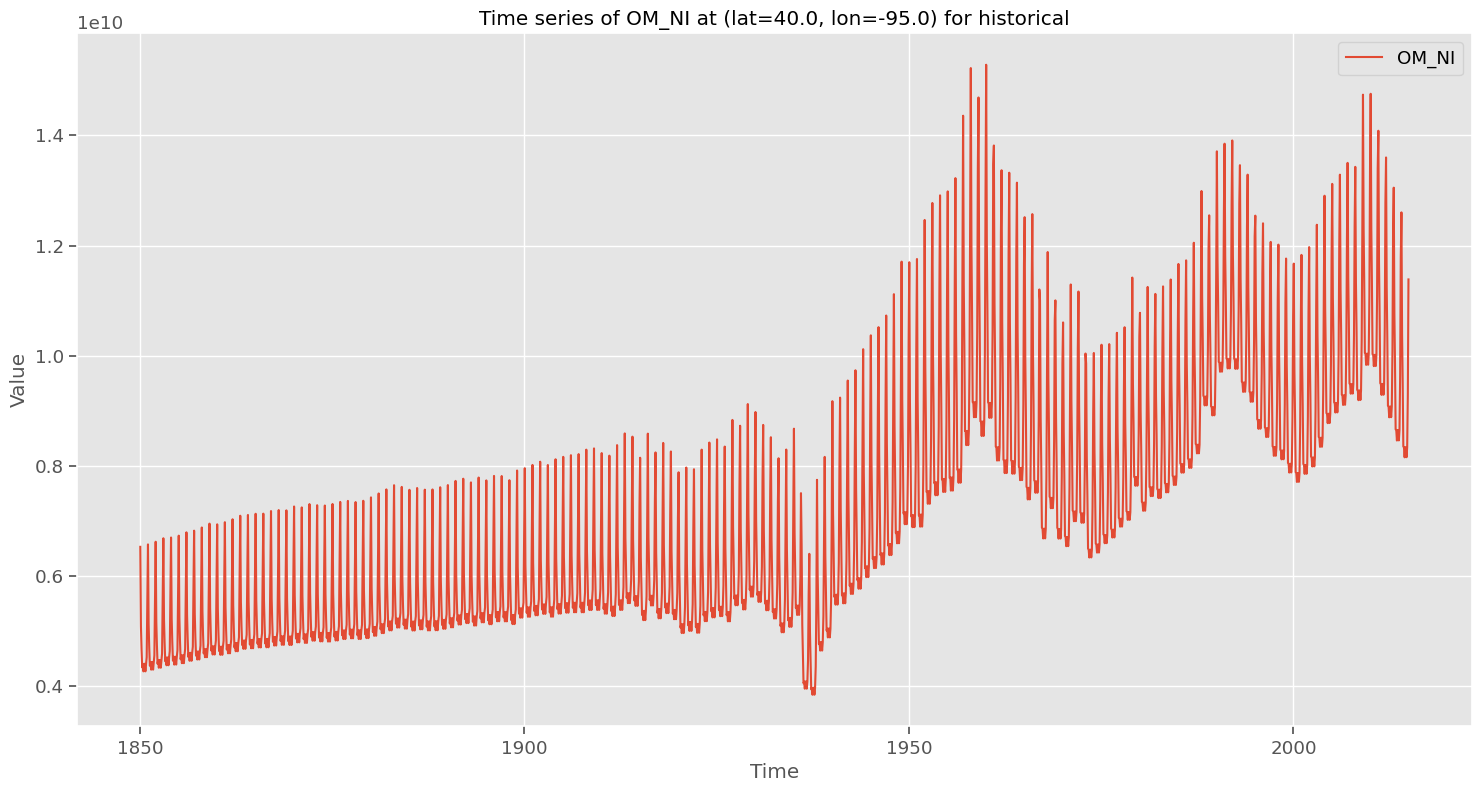
OM_NI_historical_40.0_-95.0
SO2_historical_40.0_-95.0
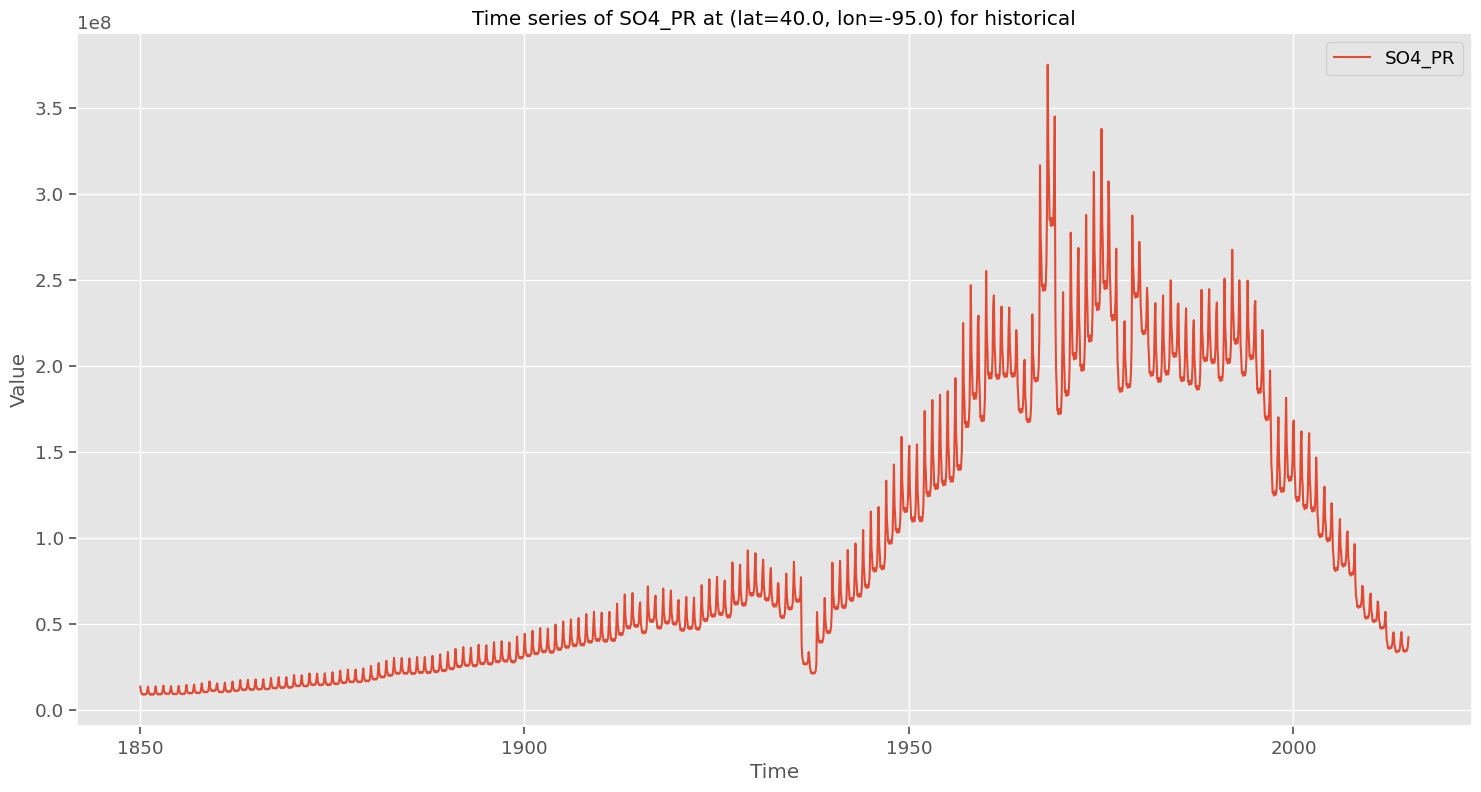
SO4_PR_historical_40.0_-95.0
huss_historical_40.0_-95.0
pr_historical_40.0_-95.0
psl_historical_40.0_-95.0
sfcWind_historical_40.0_-95.0
tas_historical_40.0_-95.0
tasmax_historical_40.0_-95.0
tasmin_historical_40.0_-95.0